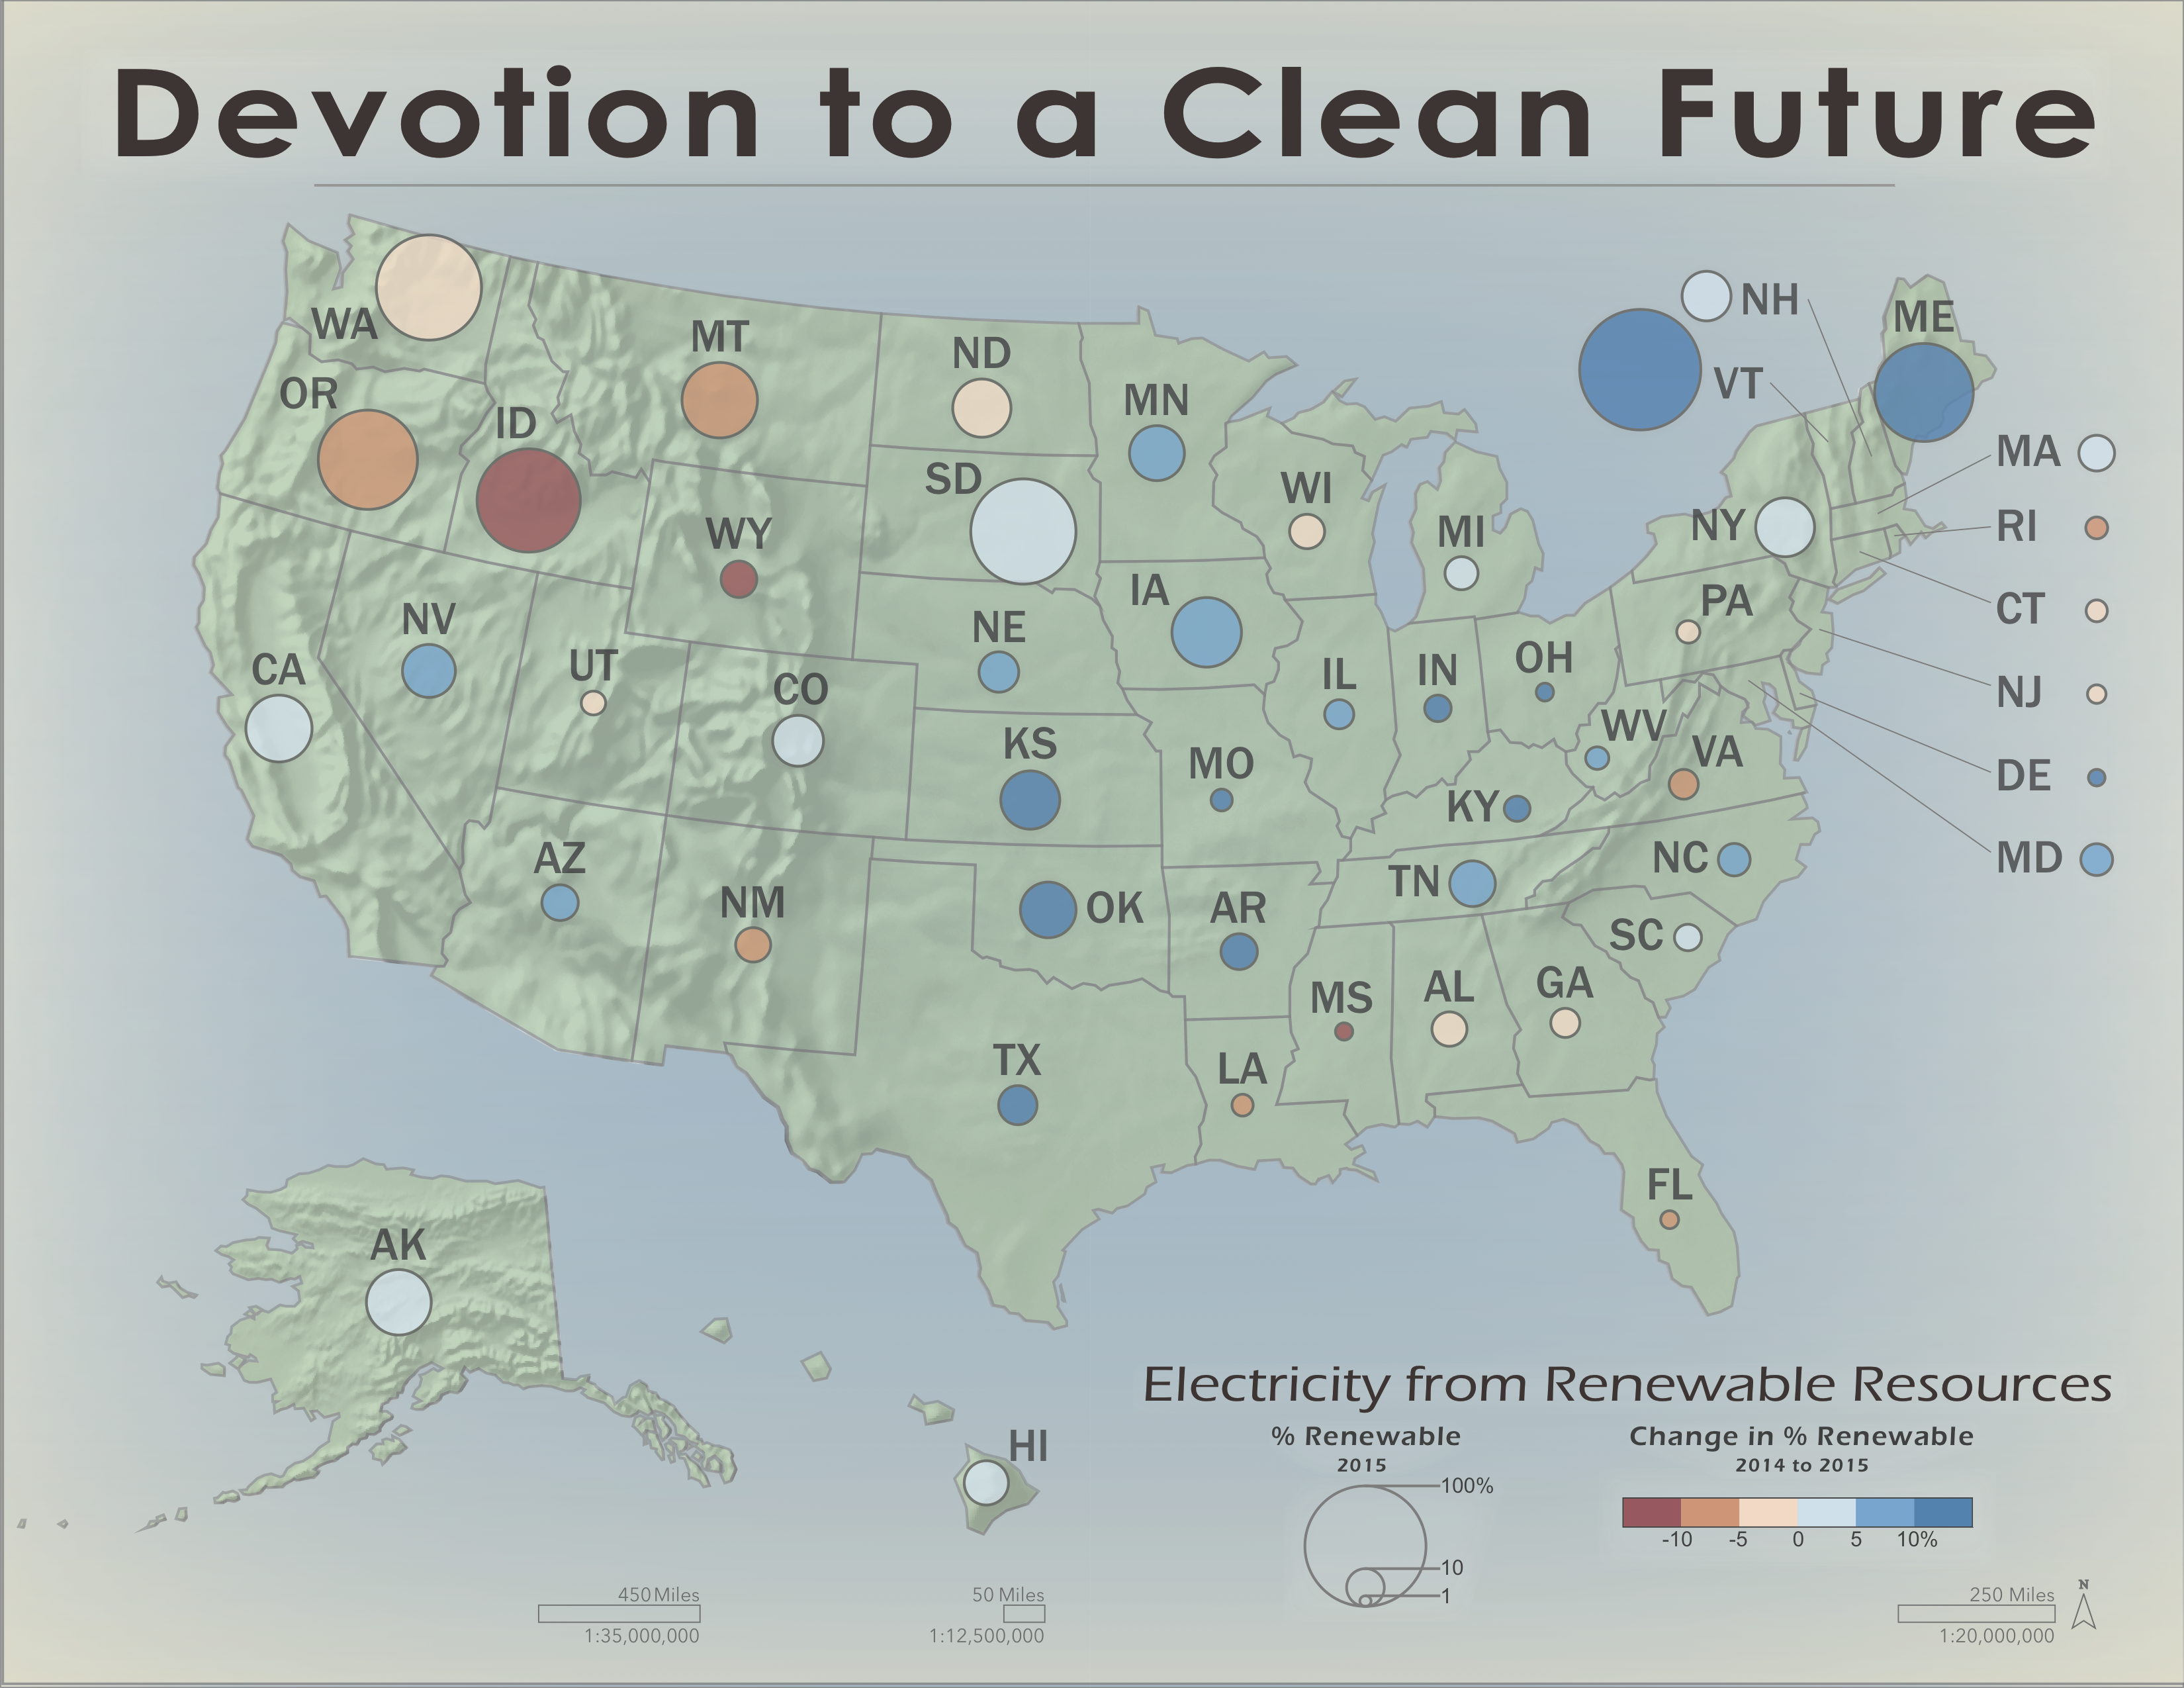
Challenged with the task to make a bivariate map, I took to the direction of clean energy statistics. I wanted to show the % of energy from renewable, as well as the change to show whether the state is increasing or decreasing in devotion. I later made an interactive map of each energy source % per state for 2016 to better understand the details of each energy source in each state.
